✦Web, Data, Dashboard Analytics · 2026
Zona QRIS
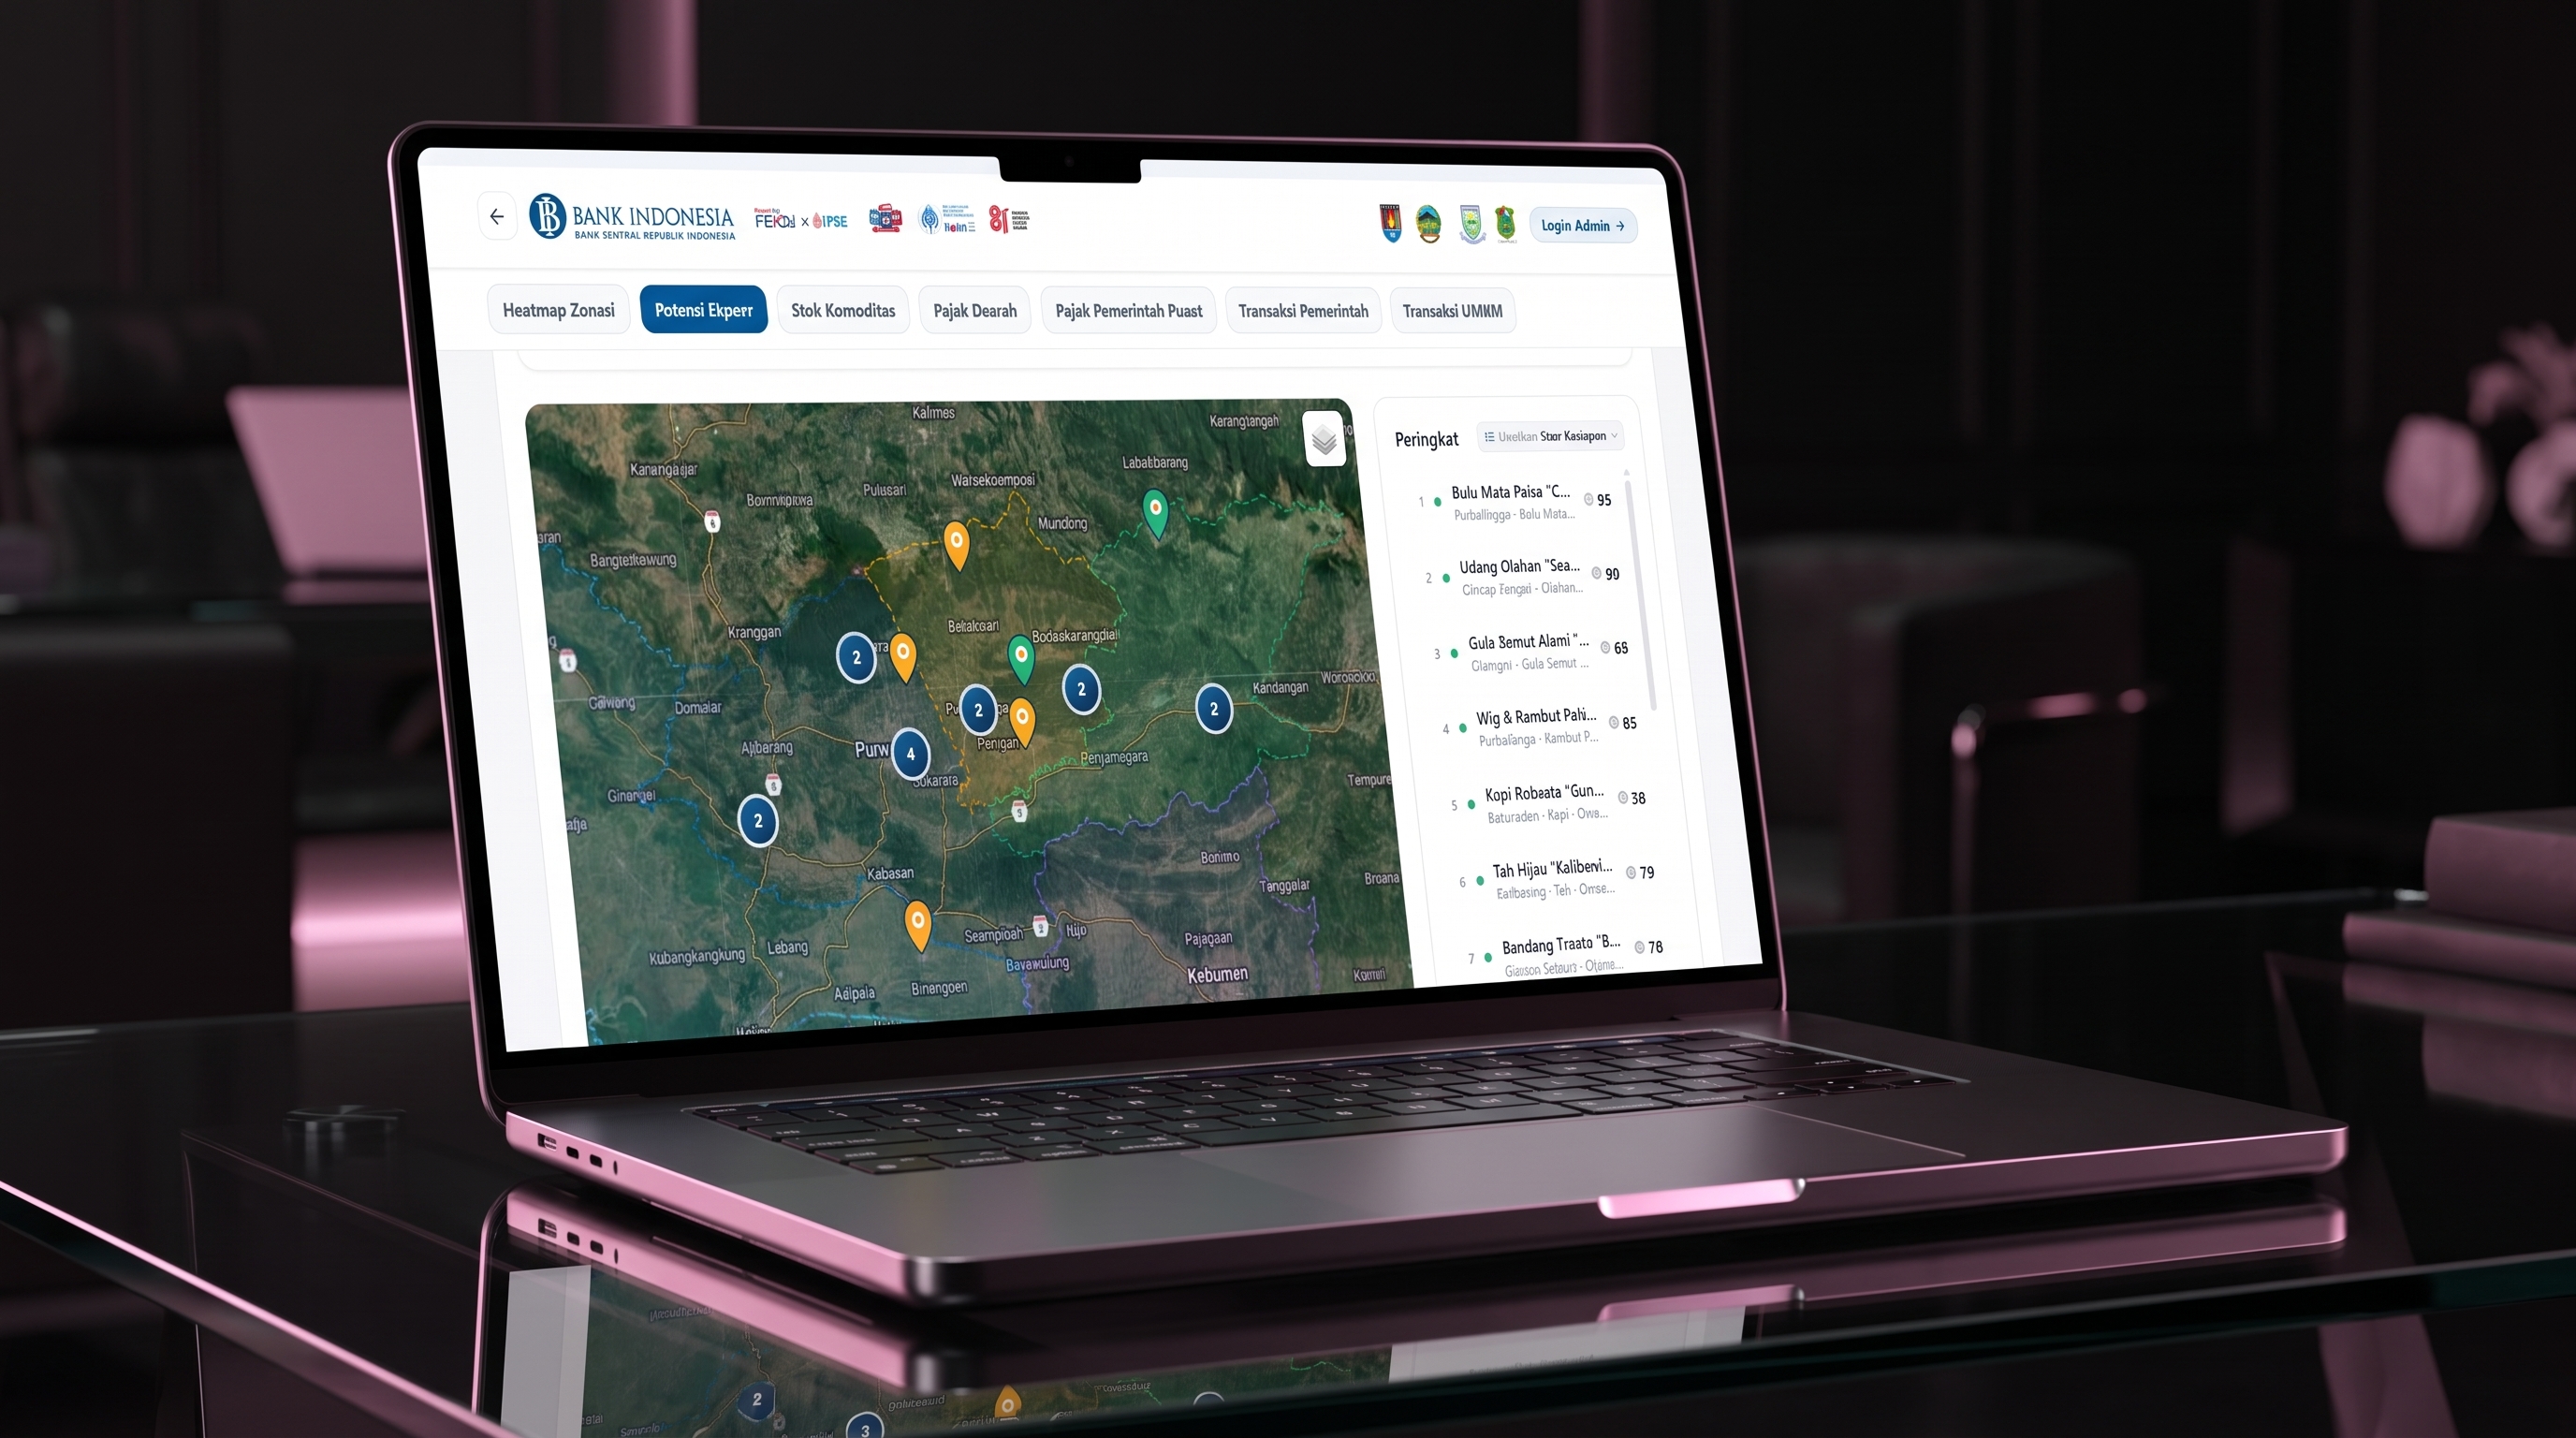
A geospatial dashboard for Bank Indonesia that maps QRIS adoption subdistrict by subdistrict — so policy can be designed by zone instead of by regional average. In active development.
Overview
1. Policy teams usually read QRIS adoption as a single regional number. Averages hide the thing that matters — one subdistrict at 80 percent and its neighbour at 12 percent both disappear into a comfortable middle. Zona QRIS was built to make that gap visible.
2. The dashboard maps adoption at subdistrict level across the five regencies of Barlingmascakeb, then layers tax data, MSME export potential, and commodity stock on top of it, so an intervention can be aimed at a zone rather than at a district.
3. Rendering it was the hard part: roughly 95,000 rows of administrative-boundary GeoJSON plus thousands of point markers, kept responsive through choropleth rendering and marker clustering. Analysts can bring their own CSV or XLSX, and export any map view straight to PNG for a policy report.
4. Currently in development — the interface layer is running, the backend is next.
Highlights
- 01Built for Bank Indonesia KPw Purwokerto
- 02Subdistrict-level QRIS adoption across 5 regencies
- 03~95,000-row GeoJSON rendered with marker clustering
- 04Cross-layers tax, export potential, and commodity data
- 05CSV / XLSX import and export for analysts
- 06One-click map export to PNG for policy reports
- 07Status: in development
Screens
Click to enlarge

Next project
PhishGuard
Web, AI, Python, Machine Learning · 2026